Ocean: From hot streak (2024) to cooler fall (2025)
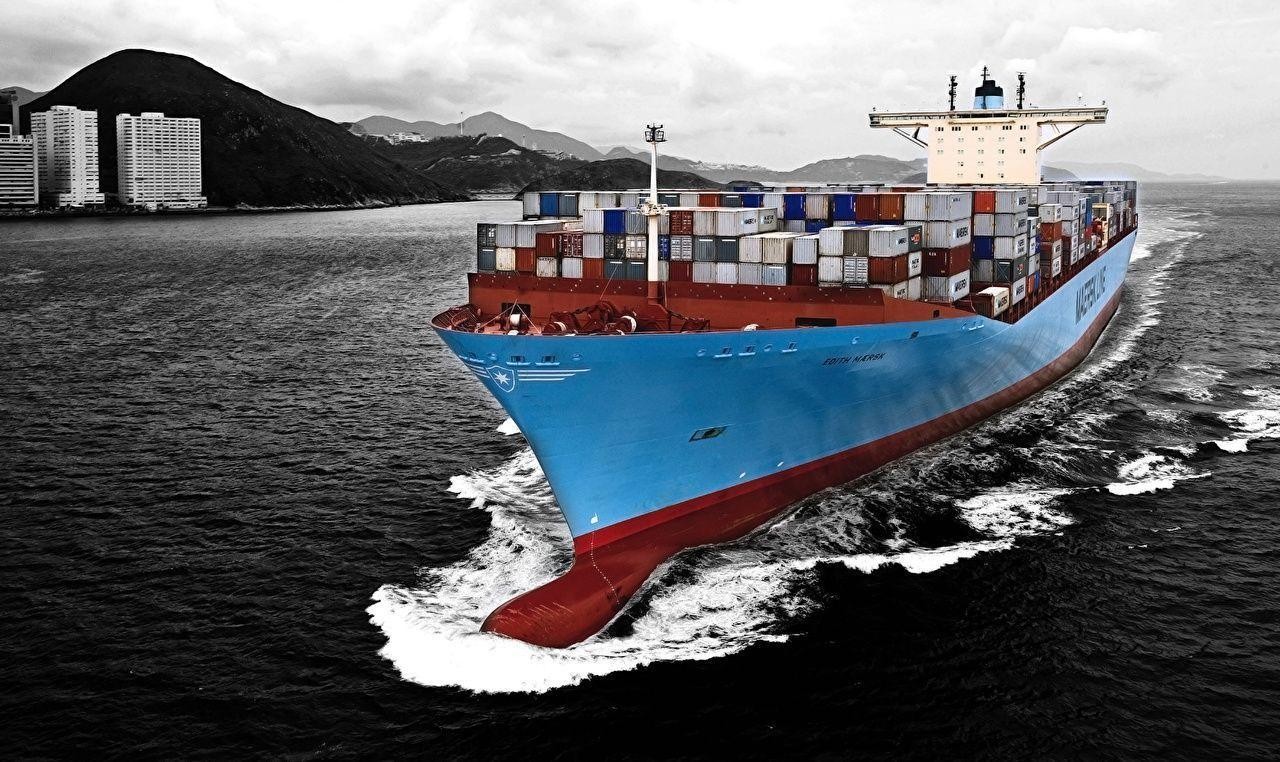
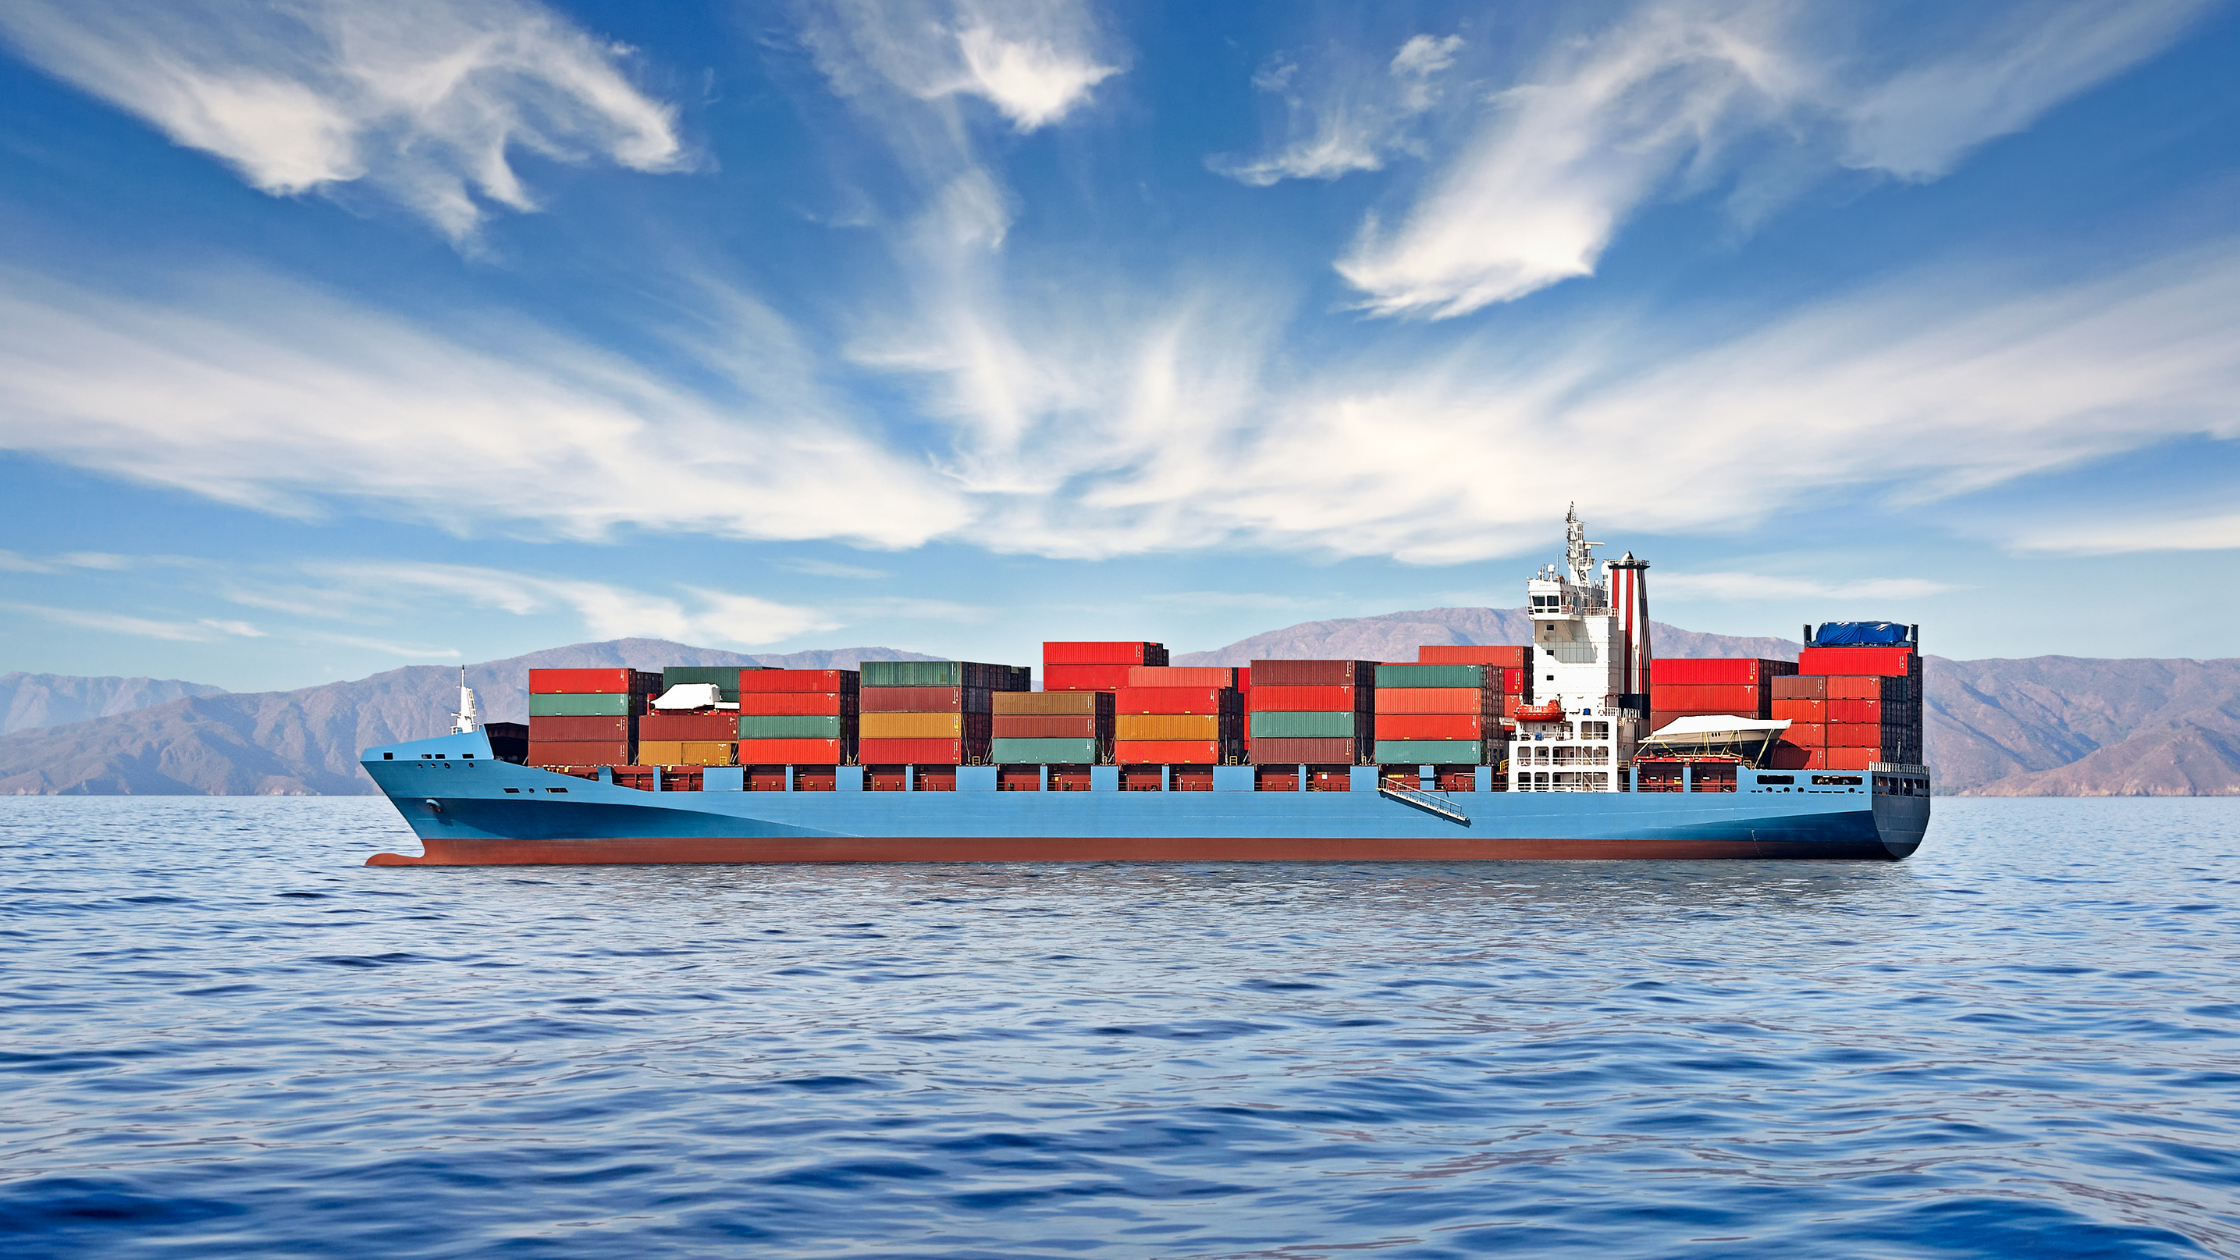
- Late-2024 run-up: U.S. containerized imports held above 2.4M TEUs/month through autumn 2024 as retailers rebuilt inventories.
- 2025 moderation: By September 2025, imports slipped to ~2.31M TEUs, -8.4% MoM and -8.4% YoY (tariff uncertainty and front-loading played a role). Year-to-date volumes were still up ~1.9% vs. 2024.
- Port pulse: At the Port of Los Angeles. America’s bellwether, 2025 YTD throughput remained ~3% above 2024, even as September eased -7.5% YoY.
Air: Slow, steady climb
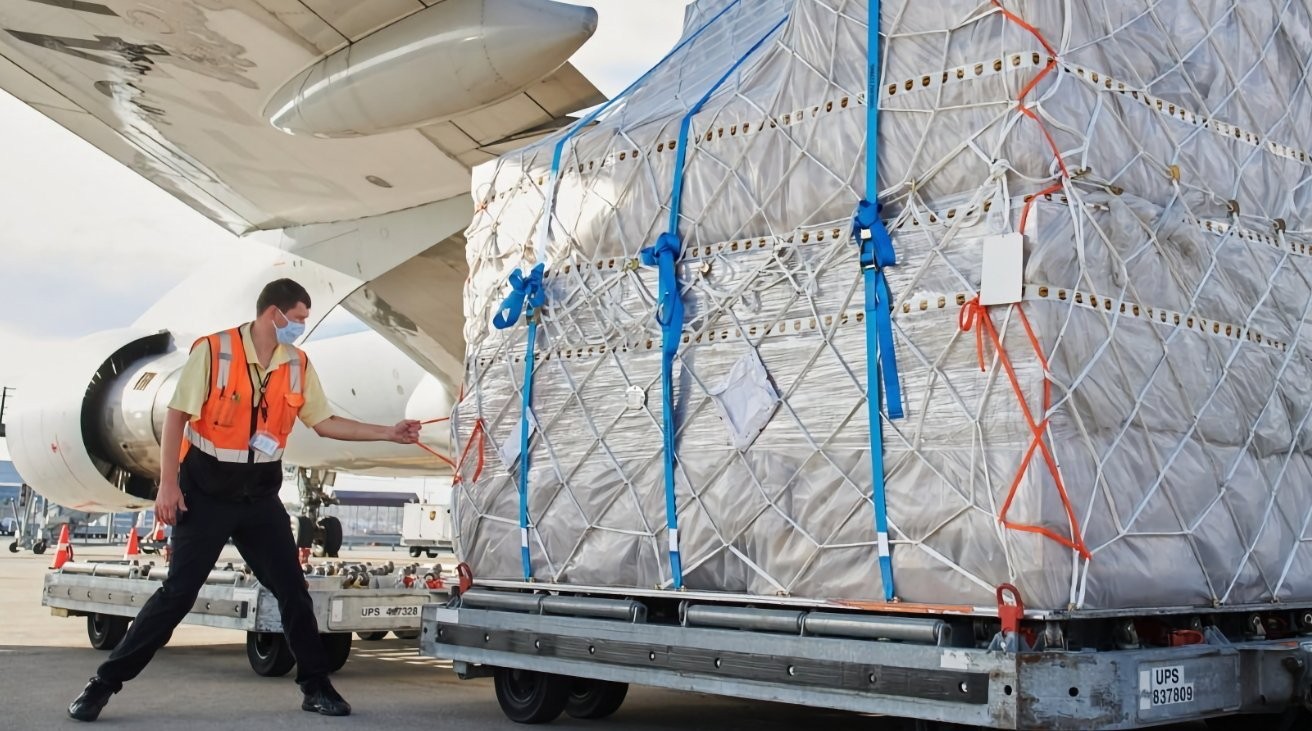
- 2025 momentum: Global air cargo demand (CTKs) rose +4.1% YoY in August 2025, the sixth straight month of growth. Europe–North America volumes were particularly firm.
- Why it’s holding up: Shippers shifted select, high-value or time-critical SKUs to air to hedge against tariff timing and ocean schedule risk.
- Data backbone: U.S. lane-level air figures are tracked via BTS T-100 datasets, which corroborate the steady recovery trend visible in industry releases.
What it means: Air is quietly gaining share where speed and tariff-timing matter (electronics, fashion drops, components). It’s not a surge, more a disciplined re-allocation.

2024–2025 Mode Choice: Fast rules of thumb
- Stable lead times + price sensitivity? Ocean. 2025 spot and contract levels are manageable after capacity additions, but plan for policy-driven spikes.
- Tariff windows, promos, or stock-outs at risk? Air (or sea-air hybrids) to straddle cost and speed.
- West Coast vs. all-water: LA/LB remain resilient (2025 YTD > 2024), but month-to-month swings reinforce the value of port diversification.
Bottom line
- Ocean: Bigger base, modestly up YTD in 2025 but cooler since summer. Great for cost control if you can flex lead times.
- Air: Six straight months of growth into late-Q3 2025; best used surgically for SKUs where timing beats transport cost.
more blogs
Recent blogs


